It was a year like no other. The impacts of COVID-19 in 2020 have been immediate and devastating for people, families, communities, and the health and social care system.
While we all live in hope at the start of 2021 that the rollout of the vaccination programme may mean some form of return to the lives we led BC (before COVID), the longer-term implications of the virus are likely to be with us well beyond mass vaccination. None more so than in our nation's mental health and wellbeing.
The ways COVID-19 has already impacted our mental health are too numerous to list. From months of isolation from our loved ones, young people prevented from attending school or college, to health and care professionals on the frontline witnessing so much death and pain from this horrible virus. COVID-19 is also already having – and will continue to have – profound indirect impacts on our mental health via the implications of the virus on the economy and businesses.
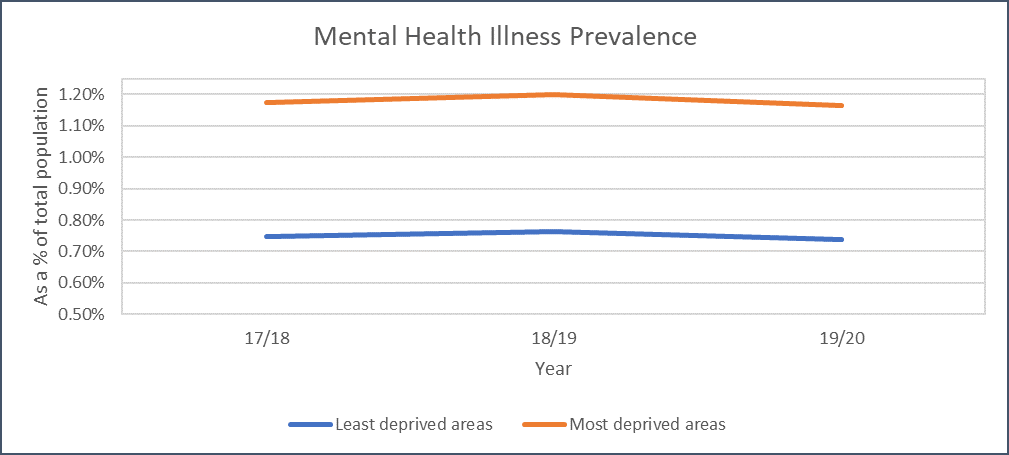
It is well known that there is a direct link between deprivation and an increased risk of suffering from a mental health illness.
The graph below, using data from the Quality and Outcomes Framework, shows that you are around 50% more likely to have a mental health condition in one of the top 10% most deprived areas in England versus the top 10% least deprived.
With businesses collapsing, redundancies increasing, the end of the government's furlough scheme this year and councils facing ever bigger budget constraints, it is likely that not only will the most deprived areas become more deprived, but many – if not all – areas will be negatively impacted economically.
Given the correlation between deprivation and prevalence of mental health conditions, this spells bad news for our mental health system. The £500m package announced by the chancellor in November's Spending Review to support mental health services in England is welcome. However, much of this funding will go on urgent acute service needs and delivery.
Councils' spending power is now stretched more than ever, with many having recently announced significant spending cuts and savings programmes in order to deliver balanced budgets in the financial year 2021/22. Combine the two and there is a significant risk that much- needed investment and transformation in community mental health services, prevention initiatives as well as partnerships with the voluntary sector will be neglected.
This would be a particular shame given the increasing focus on programmes such as Living Well – a three-year programme seeking to create new systems of mental health support across the UK – that support the creation of community-based mental health services to deliver better outcomes both at the individual and system level. Ultimately, prevention must surely be better than cure.
The combination of investment, time commitment, focus and the effort needed to transform community-based mental health services and support in all its guises across England to become best-in-class at prevention and reducing escalation is significant. But with the multiple competing interests across the system on available funds and practitioners' time, it is unrealistic to expect the full level of investment and time needed to materialise in the short to medium-term.
It is therefore paramount that whatever is available is fully maximised to deliver the best outcomes for as many people as possible.
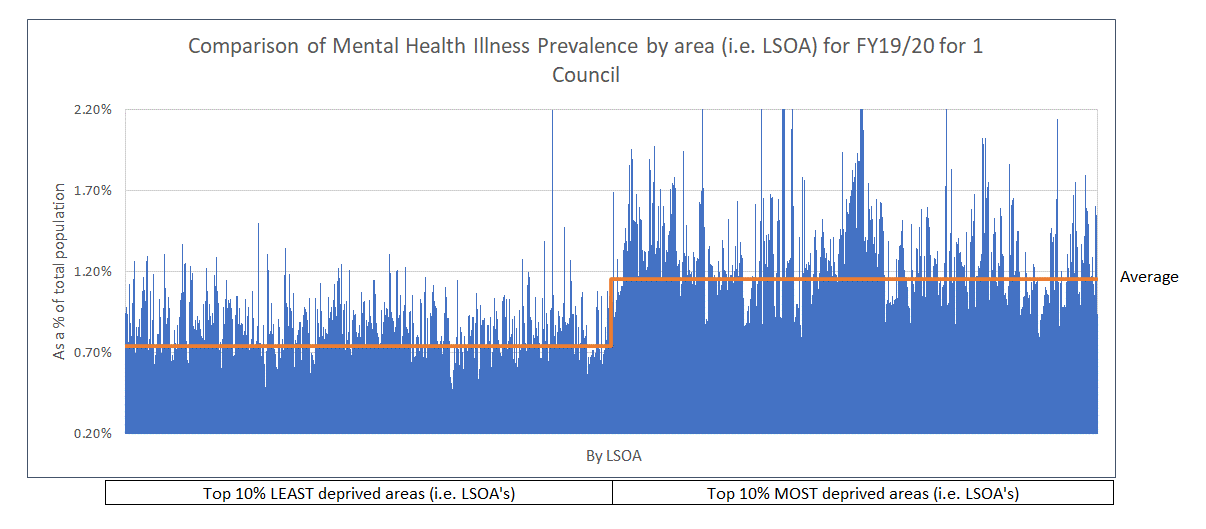
The comparison graph below, using data from the Quality and Outcomes Framework, reiterates the point that people living in our most deprived communities are more likely to suffer from a mental health condition. However, it also illustrates another point – that even within our most deprived areas, there are significant variances.
It shows that mental health prevalence can be double – or even triple – that in one deprived area compared to another.
All the data needed to build up a much fuller picture of what is happening within each area from a mental health perspective is available, including:
- Number of A&E admissions in relation to mental health (including by type of admission).
- Where mental health referrals are coming from (including the reason for the referral).
- Number of people receiving therapy (including by type of therapy).
- Where people in receipt of social care funded mental health support are from (including type of support provided).
- What available services and support – including voluntary sector – are available within each community (including the scope, geographical range and type of service).
- Key socio-economic indicators – from crime to income, from health to housing.
The challenge has been that these various insights sit across multiple different systems – in particular, health, social care and community – with no one having the full picture of what is happening within each area. Combining the data in one place will allow commissioners and practitioners to assess:
- Where the greatest (now) and increasing (over time) demand is coming from.
- What is the nature of that demand from a mental health condition perspective?
- What community assets and services are available within those areas – and whether they have the range, scope and specialisms to meet that demand (and nature of demand) now and in the future.
From there, commissioners and practitioners can begin to consider – based on their priorities and transformation focus – where and how the limited investment and resources available can best be deployed. They can then assess the impact over time to see if it is working.
For example, has there been a reduction (or slowing in the growth rate) in the number of A&E admissions over time – including by type of condition?
The map below – using data from Grant Thornton's Springboard Data Platform – is an anonymised example of how overlaying some of this data can highlight where the biggest pressure points within community mental health service provision lie.
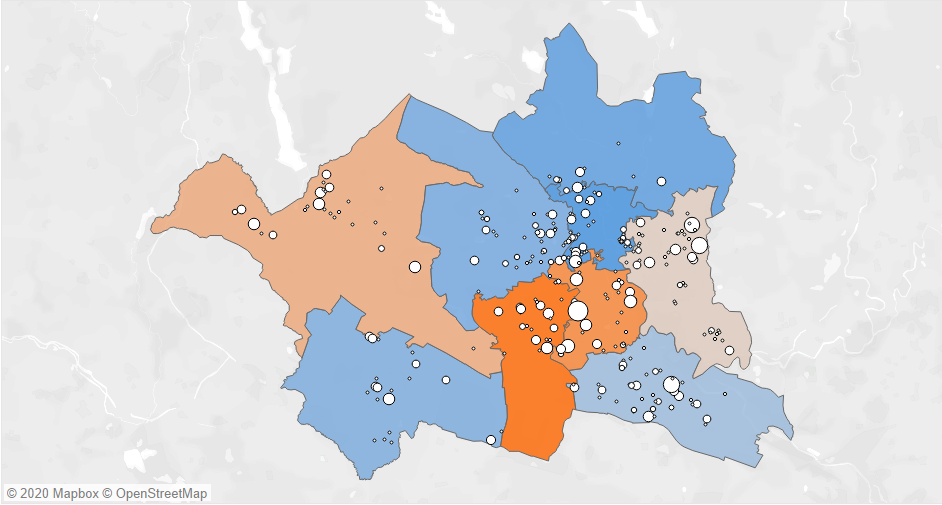
In this example, the areas highlighted in orange – or pale pink – reflect where the greatest number of mental health referrals/admissions into acute settings are coming from. This map has then been overlaid with a series of ‘bubbles' that reflect various types of assets and services available within those areas to support people with mental health conditions. The bigger the bubble, the bigger the capacity of the asset/service.
This enables councils to build a comprehensive picture of prevalence, demand and the available support services – broken down by type of mental health condition and at a micro-community level as needed. Based on the anonymised example, commissioners may consider that there is a lack of (known) available assets and services in the south of the locality highlighted in the darkest orange (i.e. the locality with the current highest number of mental health referrals/admissions into acute settings).
Many in our communities go above and beyond in their efforts to support as many people as possible suffering from mental health conditions. Combined, comprehensive data insight in one place on what is really happening – and what is available and what is not – in community-based mental health can become part of the way forward.
Nick Clarke is head of social care consulting at Grant Thornton UK LLP